Nowadays knowing performance and health condition of IT applications at the first place becomes increasingly crucial for any IT domain. Many organizations have been turning more digitalization capabilities into competitive advantage and revenue growth, therefore disruption of underlying IT systems or products can incur dramatical impacts to enterprise's reputation, finance and operation, in addition to embracing the evolving technologies and techniques to improve IT service quality, monitoring play an integral role to proactively prevent incident or improve the recovery time in an emergency.
On the technology side, effectively monitoring 100% of IT systems and infrastructure can be quite a challenge, in a typical modern IT corporation, a service-oriented, cloud-based and event-driven architecture can incorporate thousands of interoperated, autonomous micro-services, along with thousands of changes or deployments happen every day, which makes the traditional lowly integrated, labor-intensive monitoring impractical.
Moreover, many businesses treat monitoring the last or least important thing in the product delivery pipeline, led to "silo-monitoring" capabilities as separated IT teams focus on specific parts of overall IT infrastructure, each team deploys monitoring tools that work well with specific systems. In the author's company, we used to have 7+ monitoring tools at the same time across business units, many teams end up working on the same problem, none of team gained the in-depth expertise of the specific monitoring tool since most of team only engaged with a small part of monitoring functionality and assumed no responsibility to extend the tool usage, and you can not readily trace incident across products because all information spread in different platforms.
In this article, I will introduce approaches and experiences we've learned over the years in building up an universal, practical, operable, scalable enterprise monitoring architecture, which aims to increase the overall enterprise application uptime by addressing the cross-cutting technical concerns in monitoring. I do not intend to provide an exhaustive list in every aspect of monitoring, but more focus on shedding some light on what key considerations you should have in system design and providing options in pattern or tool selection.
Monitoring Vision and Business Drivers
Enterprise monitoring utilizes centralized systems, platforms and a set of standard procedures to collect, analyze, predict and report system performance, the ultimate objective of enterprise monitoring is to increase application availability by preventing incident from happening, or reduce the time to recover from problems.
To understand the dynamical business requirements of proactive and complete monitoring, here is a list of drivers of establishing enterprise monitoring capabilities:
Business Drivers
- Increasing revenue. Monitoring’s primary focus on availability and performance drives improved customer experience, leading to increased revenue.
- Protecting brand value. Monitoring’s ability to detect problems and provide analysis on customer issues early enables reduced customer impact time. It helps organizations serve customers when they need the service. Public-facing web applications are monitored continuously by products like Downdetector, which provide visibility for the press and blogs. Customers have even higher expectations on service availability on peak days such as Black Friday and Cyber Monday.
- Operational excellence. Synthetic monitoring captures in-depth information needed for triage teams with insights for quick root cause analysis and service restoration. Proactive monitoring combined with triaging insights helps I&O teams to focus more time on improvements and automation rather than firefighting, thereby saving time and money.
Specific Industry Drivers
- In certain industry, stability and uptime requirements are stipulated or regulated in a specific way, such as in financial industry, rigorous service level agreement can be applied to investment transaction systems.
Technology Driver
- Rapidly changing software and service requirements in a changing environment.
- Increasing frequency of application changes, server patches and software upgrades.
- Increasing infrastructure and architecture complexity.
Operation Drivers
- Operation efficiency and cost optimization in a context of growing business and growing team size
As such, the main objectives of monitoring architecture design derived from forementioned drivers are as follows:
Business Objectives of Enterprise Monitoring
- Identify issues before users' awareness.
- Escalate to proper resouces.
- Be able to proactively define defence strategy for ongoing risks.
- Automatically adapt or minimum maintenance efforts to even-changing technology stacks and environments.
- Copy to new services and adapt to changes easily(fast, cost optimized).
Business Architecture
A Typical Monitoring Business Case
Figure 1 demonstrated a reactive monitoring case from data collection to issue resolution. In addition to general monitoring and escalation process, organizations can have their specific proactive management process, knowledge transfer and self-service process that pertain to overall monitoring capability.

Figure 1. A Case for Reactive Monitoring and Escalation
Organization Structure
Organizationally, monitoring capabilities serves for multiple roles as companies shifted to agile product development and DevOps shared responsibility model, this substantially changes the audiences of monitoring as well as the expectations for the platforms.
Stakeholders who will be involved in the monitoring capabilities and their expectations are:
- Operations Team: Looking for on-site monitoring, intelligent event correlation(reduce false alert), ease of use in setup, configuration and deployment, cost optimization, flexible escalation policy, comprehensive documentation, intelligent root cause analysis, diverse visualizations and reports.
- Full Stack Developers: Looking for simple setup and deployment, flat learning curve, ease of issue tracking, intelligent event correlation.
- Product Owner: Looking for indicators of service availability, performance, alerts before users' awareness, adequate monitoring.
- Executives: Expecting organization-wide key performance indicators (KPIs) that are based on the health and performance of critical business systems.
Business Service/Function catalog
Requirements from Business Modeling:
Issue pinpointing capabilities:
- What's broken? - (symptoms)
- and why is it broken? - (causes)
- Escalation capability to responsible group/personnel.
- Exploratory capability and enables identification of "unknown unknowns".
- Dashboard capabilty to get an overview of healthiness or status.
- Prediction capability to prevent incident from happening.
- Event correlation capability to reduce alert fatigue.
Non-functional requirements.
- adequate
- holistic
- data-centric
Function Catalog
Data Foundations
- Collection
- Ingestion
- Storage
- Exploration
- Visualization
- Reporting & dashboard
- Alerting & Notification
Data Analytics
- Anomaly Detection
Event Correlation: is a technique for making sense of a large number of events and pinpointing the few events that are really important in that mass of information. This is accomplished by looking for and analyzing relationships between events.
- Event correlation can be decomposed into four steps: event filtering, event aggregation, event masking and root cause analysis. A fifth step (action triggering) is often associated with event correlation and therefore briefly mentioned here.
- Event masking: (also known as topological masking in network management) consists of ignoring events pertaining to systems that are downstream of a failed system. For example, servers that are downstream of a crashed router will fail availability polling.
- Predictions: prediction in monitoring is usually used for detecting potential capacity resouces gaps such as disk space or network bandwidth requirements to mitigate future risks
Data Architecture
Data Principle
Data is essential to the success of corporate monitoring capability, uniform understanding should be agreed across groups before design and implementation of monitoring solutions. The common principles include following aspects:
Data is shared:
- Shared monitoring data can be accessed anywhere by authorized users.
- To enable data sharing we must develop and abide by a common set of policies, procedures, and standards governing data management and access for both the short and the long term.
Data is accessible
- Accessibility involves the ease with which users obtain information.
- The way information is accessed and displayed must be sufficiently adaptable to meet a wide range of enterprise users and their corresponding methods of access, common practice includes providing API to access monitoring data as much as possible.
- Common and shared Vocabulary and Data Definitions
Data Security
- Security needs must be identified and developed at the data level, not the application level.
- Data security safeguards can be put in place to restrict access to "view only" or "never see".
Conceptual Data Models
Monitoring Data Classification
In data model design, the most common taxonomy is to classify the monitoring data into 3 data types:
- Metrics, provides quantitative information about processes running inside the system, in the format of counters, gauges, and histograms.
- Logs, is the information automatically produced in the form of time-stamped documentation of events relevant to a particular system.
- Traces, aka distributed tracing, provides insight into the full lifecycles, or traces of requests to the system, allowing you to pinpoint failures and performance issues.
These 3 verticals are tightly interconnected. Metrics can be used to pinpoint, for example, a subset of abnormal traces. Logs associated with those traces could help to find the root cause of related behavior. Meanwhile new metrics or logs can be configured, based on this discovery, to catch this issue earlier next time.
Monitoring data can be also classified in 3 categories from data source perspective:
- Machine Data, generated from IT systems, applications or devices like servers, client devices, network routers, security devices, IoT and sensors, most machine-generated data is self-reported information in form of metrics or logs.
- Wire Data, is the information that passes over computer and telecommunication networks defining communications between client and server devices. It is the result of decoding wire and transport protocols containing the bi-directional data payload. Typically wire data is the information communicated between layer 2 to layer 7 of the OSI model (Layer 1 not being included because those protocols are used to establish connections and do not communicate information). Unlike machine data which are dependent on logging configurations of applications or devices, wire data is defined by wire and transport protocols.
- Agent Data, generated by agents from monitoring vendors, agents can either be injected to application or language runtime to collect statistics of function call and stack usage, or act as a real user to execute a function of service to grab performance metrics. Another typical usage of agent is to deploy probing nodes in multiple locations, used in detecting end to end network availability and performance disparity among regions, such as ICPM ping, HTTP get test.
Moreover Gartner suggested to distinguish monitoring data through 2 most frequently asked questions from where monitoring takes place:
- "Black-box" monitoring examines visible information to answer the question "Is it broken",
- "White-box" monitoring exposes the details from inside of the system to reveal the valuable information to answer "Why is it broken".
Remember the characteristic of monitoring data in this way can greatly help you to understand how to design the content format for metrics, logs and tracing data.
Conceptual Data Diagram
The following matrix can help to understand the typical cases of what types of monitoring data are expected based on data sources.
| Metrics | Logging | Tracing | |
|---|---|---|---|
| Machine Data <br/>Availability Insight <br/>Performance Insight | * | * | |
| Wire Data <br/>Network Insight | * | * | * |
| Agent Data<br/>Application Insight<br/>User Experience Insight | * | * | * |
Table 1. Monitoring Data and Sources Matrix
Ideally the metrics, logs and traces collectively constitute the 3 pillars of observability, this relationship is demonstrated as follows:

Figure 2. The Pillars of Observability source: Gartner, 2018
Because the nature of data type determines the observability and usage pattern, in this article the metric, log and trace are used to design data model and instruct application architecture.
1. Metrics
The first, and most critical domain in the monitoring platform is metric. For many monitored elements, all of the golden signals come from metrics.
Definition
A metric is a measurement usually comes with a series of tuples comprising a value and a time stamp, it's highly recommended to provide metrics along with associated metadata, as oftentimes the name of metric cannot be interpreted literally, the percentage of disk space utilization can mean either remaining disk space or usage rate. We will not discuss the advanced techniques of metadata here, the typical metadata for a metric should include at least the source of collected data and the formula of associated metric
The value of metrics comes from analyzing multiple instances of a metric over time, contrary to limited information from a single instance, we typically use the trend or the aggregation of metrics to determine whether services and applications are broken.
Structure of Metrics
A basic metric consists of name, time stamp and value. Many traditional practitioners used the name to encode metadata of metrices. For example, pro.us-east-1a.instance0.error_rate represents the error received on instance0, this hard-coded name brings in orphaned metrics by some short-lived entities, as well as complexity for analysis since aggregation between scattered metrics with different names, although they might mean to same subject. Imagine that you want to analyze the error rate for one application for multiple availability zone, dealing with a dozen of metrics with name prefixed by AZxx is a nightmare. Tags or labels are more elegant to classify metrics entities as a additional and optional metadata, however, adding more key-value data to a time series brings together the cost in storage and processing, the theory "cardinality" can be employed to measure the potential impact of storing labels. The cardinality of a metric is the number of unique time series with which that metric is associated, and the cardinality of a label is the number of unique values associated with the label key.
- Name: The identifier of the metric.
- Time stamp: The date/time associated with this data point.
- Value: The numeric quantity associated with this data point.
- Labels [optional]: Additional context in relation to metric entities, such as to which server, availability zone the data refers , a.k.a. tags or dimensions by some vendors. Eg, labels="evn=production, AZ=us-east-1a, instance=instance0", some practitioners use metrics with label-like metadata as "dimensional" metrics that has a variety of attributes attached, this amount of details allows for in-depth analysis and querying.
The Metrics Life Cycle

Figure 3. Life Cycle of a Metric
2. Logs
Definition
Logs typically includes information of what happened from the interior of the system, it is an integral part of an observability-based monitoring strategy. In the contemporary technology world, in addition to pinpointing the question "why is it broken", a growing number of companies are mining logging data to gain business insights, such as customer churn prediction, or prospective client analysis.
Structure of Logs
The majority of log data is essentially the raw un-structured text, however, in order to be easily consumed in later stages, text log data is recommended to be organized in structured forms. Typical log formats include:
| Format | Description |
|---|---|
| Text | Arbitrary strings emitted as free-form text. Certainly the most common raw format. |
| Structured | The most common way is key/value pairs along separated with comma, can also be XML, JSON, etc. |
| Binary | Less common, but could be packet capture (pcap), netflow or even database transaction logs. |
Table 2: Log Data Formats
The most common log data comes from software applications or technical services in the format of text files, therefore the reasonable performance of searching in arbitrary unstructured text is inevitable challenges everyone needs to deal with, the most appealing solutions in the industry are two types of NoSQL databases:
- Key-Value(KV) databases, data objects of arbitrary composition are serialized, associated with a key. KV database is very much akin to a hash table, it provides high performance and scalability on searching on single value, while inefficient in indexing and retrieval of multiple values. Typical KV databases include Memcached, Redis and Riak KV.
- Document databases, build upon the capabilities offered by KV databases by allowing a more comprehensive ability to index and query upon the values — often structured documents in JSON or XML format. Examples of document databases are DynamoDB, Elasticsearch and MongoDB.
In view of optimization for searching semi-structured log data in search engine such as Splunk or Elasticsearch, here are general guidelines for logging practices:
Log File
- Log files must be in UTF-8 format.
- Log files must not be owned by root/administrator users, and must be readable by other/everyone, which adheres to data principle "Data is shared". For security concern on sensitive data, corresponding access control can be taken place at platform level, for example, Splunk can control which role has access on specified indices.
- Log file must be rotated based on either file size or date.
Log Line Format
- Capture log records on a single line using a key="value" format. This format looks like:
hostname="" client_ip="<client_ip>" service_name="<service_name>" ... - Separate key-value pair with space character.
- Enclose values in double quotation marks (").
- Use single quote character(') within quoted value.
2019-10-21T15:46:35.123 hostname="testinstance01" event_description="User 'Tom' logined at ...."
- Capture log records on a single line using a key="value" format. This format looks like:
Any custom Keys consist only of letters, numbers, and underscore (_) character.
- Use of standard timestamp at the beginning of each line, don't use of timestamp as a key.
- Use of standard timestamp in UTC time zone.
2019-10-21T15:46:35.123 hostname="testinstance01"
A completed example:
2019-10-21T15:46:35.123 hostname="testinstance01" source_ip="10.16.18.100" service_name="test_service" event_type="authentication" event_status="success" event_severity="info" event_description="User 'Tom' logined at ...." request_id="67abf84d-be01-4a68-af5a-435b9f1f7acd"Key List
- Each business line should define their own required/optional key list, the required key can be used to maintain consistency across technical services and reserve useful information for addressing issues and further analytics, here is an example for such a key list standard:
| Key | Description | Example | Required/Optional |
|---|---|---|---|
| timestamp | Format: yyyy-MM-ddTHH:mm:ss.fff (ISO 8601 Standard using local time and unspecified time zone) | 2019-10-21T15:46:35.123 | Required |
| event_description | The description of the event being initiated. Examples are: "Authenticated to System", "Accessed record #1234" | event_description="Authenticated to system" | Required |
| event_status | The status of the event being initiated. Can be "success", "failure" | event_status="success" | Required |
| event_type | The type of event being initiated. Can be "authentication", "read", "update", "delete", "insert", "administrative", or other application-defined values. | event_type="authentication" | Required |
| service_name | The name of the application or service | service_name="service_a" | Required |
| request_id | Correlation token set at system entry used to relate all log records for a logical request together. | request_id="8b09b812-4a29-456a-aecd-ce66d9d6efbc" | Required |
| event_severity | The severity of the event. Applicable for log levels WARN and ERROR. Acceptable values are "critical", "high", "medium", "low",or "error", "info", "debug" | event_severity="error" | Required (when applicable) |
| client_ip | The IP address of the client initiating the event | client_ip="192.168.1.2" | Required (when available) |
| data_source | The data source which provided the answer to the query. Used to debug where the data came from if a query might have been served from one of a number of systems. | data_source="Data Warehouse" | Optional |
| start_time | The start time of the event in ISO8601 format. Used when tracing the performance of a user request end-to-end. | start_time="2012-04-20-15T13:45:30.125" | Optional |
| end_time | The end time of the event in ISO8601 format. Used when tracing the performance of a user request end-to-end. | end_time="2012-04-20-15T13:45:31.425" | Optional |
| execute_time | The execution time for the event in milliseconds. Used when tracing the performance of a user request end-to-end. The value should only be numbers. No commas or period characters are allowed. | execute_time="1300" | Optional |
| method | The method associated with the event. Used when tracing the performance of a user request end-to-end. | method="logExecutor" | Optional |
| exception_message | The message associated with an exception if an exception is thrown. | exception_message="Internal Server Error" | Optional |
| exception_stack_trace | The stack trace associated with an exception if an exception is thrown. | exception_stack_trace="at com.companyname..." | Optional |
| exception_type | The type of the exception class associated with an exception if an exception is thrown. | exception_type="com.companyname..." | Optional |
Table 3: Recommended Key List for Log
3. Traces
Definition
A distributed trace is a set of events, triggered as a result of a single logical operation, consolidated across various components of an application. A distributed trace contains events that cross process, network and security boundaries. A distributed trace may be initiated when someone presses a button to start an action on a website. Each traceable unit of work within the operation generates a span. This could include an API gateway, a service or even a function call.
The goal of tracing is to follow the program flow or data progression, contrary to logging what is more reactive, we collect traces for optimization or proactive analysis. Typical use of trace data comes from a http request, a cross function call among distributed micro-services, or a user action history throughout the single activity(eg. pay the bill), all of tracing use case share the same requirements that to link information from one scenario to subsequent scenarios.
Structure of Traces
The following is an example Trace made up of 6 Spans:
Figure 4. Relationship Between Spans in a Trace
Sometimes it's easier to visualize Traces with a time axis as in the diagram below:
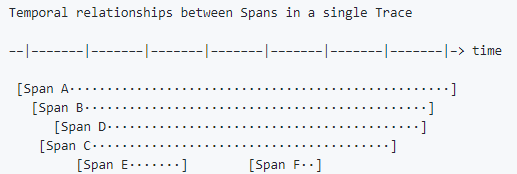
Figure 5. Timespan Between Spans in a Trace
Let's take the HTTP API transaction example from opentracing.io, the trace of that transaction might look as following:

Figure 6. OpenTracing Example Transaction Source: Gartner & opentracing.io
Challenges of Designing Trace Model
If we think of tracking between services or systems, a distributed tracing capability is usually required as most of modern software applications are distributed, micro-services based and heterogeneous, as such, one of the challenge to design distributed tracking is to be able to collect the data asynchronously while maintaining the lineage and sequence among the spans.
Another difficulty originates from timing of micro-services development. Imagine that the micro-services might be developed in different time windows, it is extremely challenging to integrate the services that will be developed 3 years later without breaking the current tracing design and platform.
Moreover, tracing data is the most application-specific and can be challenging to collect consistently, a better design should find a sweet spot among cost, collection performance and widespread applicability.
Google's Dapper tracing system provided an complete implementation for tracing service performance data. And most of tracing idea, terminologies actually derived from the paper, "Dapper, a Large-Scale Distributed Systems Tracing Infrastructure," published in 2010, that described that system. Zipkin, developed at Twitter, is based on the Dapper paper and is available on an open-source basis as OpenZipkin.
On the other hand, OpenTracing, curated by CNCF that is intended to unify distributed tracing APIs, focused on providing vendor-neutral tracing standards. It is recommended to refer to open standards and adopt as much as possible since the concept is accepted and implemented by many organizations and vendors.
Event
In the software industry, events can be thought of as simply “things that occur in a system.” For example, a server setting being changed would be an event. Another example: a website user clicking a mouse.
Some events will generate a stored record, and that record is typically also called an event.
Event data represents discrete occurrences and typically will have a high level of detail, so event data is suited for detailed analysis and querying. The downside to the use of event data is that there are typically so many events reported that it can become difficult to query that large dataset over longer time ranges.
Most of APM or commercial monitoring tools will have their own unique event data model to fulfill the requirements pertaining to notification and escalation, however, from a technical point of view, it can follow the similar design as we do in logging data, since the majority of events can use the semi-structured text format such as key-value pairs.
Application Architecture
Application/Function matrix
When assessing solutions in this space, it is tempting to weight the visualization and analysis capabilities heavily, and this remains a differentiator for many monitoring tools vendor. Two other, important capabilities depend on the types of data that you plan to send and whether the tool will be used for incident notification are as follows:
- Data mapping and ingestion versatility: Because log data can take so many forms, acquiring logs from specific infrastructure or applications may require custom processing or field mapping. This is necessary to ensure that the tool can properly ingest the data being sent — particularly for text-based logs. Structured logs, which take the form of a set of key-value pairs, can be slightly easier to ingest. However, normalizing the key names when consuming events from multiple sources may require some additional work.
- Notification capabilities: These vary widely, and when notification is part of your log management use case, Gartner recommends ensuring that the tool's capabilities support your enterprise notification requirements. Centralized notification platforms, such as PagerDuty, may simplify this by separating event management from notification.
Below matrix demonstrated the most common components and major functions which are considered in comprising the comprehensive monitoring platform in the context of a large enterprise.
* = optional
| Category | Component | Function | Metrics | Logs | Traces | Description |
|---|---|---|---|---|---|---|
| Data Collection | Monitoring Management Console | X | X | X | UI for managing and configuring agents, synthetic monitoring, APM, etc. | |
| Agent | X | * | X | logs can also be collected by agent-less mechanism | ||
| Data Management | Ingestion | Ingestion API | X | X | X | |
| Adaptor | X | X | - | Converts data from one source to another source, it resembles light version of traditional ETL tools such as Informatica | ||
| Calculation | X | - | - | |||
| Storage | Storage Platform/Engine | X | X | X | ||
| Storage Lifecycle(rotation, etc) | X | X | X | |||
| Metadata management | X | X | - | Metadata provides basic information for describing monitoring data points | ||
| Data Analytics | Exploration | Exploration Console | X | X | X | |
| Visualization | Reporting & Dashboard | X | X | * | APM solutions typically provided hybrid dashboard which combines metrics and traces | |
| Data export | Data Export UI | X | X | - | ||
| Data Export API | X | X | ||||
| Alerting & Notification | Alert Manager | Alert Engine and Console | X | X | - | Provides data processing to generate alert or event and provide management UI |
| Notication | Event Management Console | X | X | - | UI to acknowledge, resolve or snooze events. | |
| Event API | X | X | - | |||
| Paging Tool | X | X | - | Includes features to define escalation policies, rotations and paging vehicles. | ||
| AIOps(optional) | Anomaly Detection | X | X | - | ||
| Event Correlation | Event filtering | X | X | - | ||
| Event Aggregation | X | X | - | |||
| Event masking | X | X | - | |||
| Root Cause Analysis | X | X | - | |||
| Action Triggering | X | X | - | Capability to automatically resolve events | ||
| Prediction | X | - | - |
Table 4: Monitoring Function Matrix
Technical Component Architecture
Enterprise Monitoring Architecture - Put Everything Together
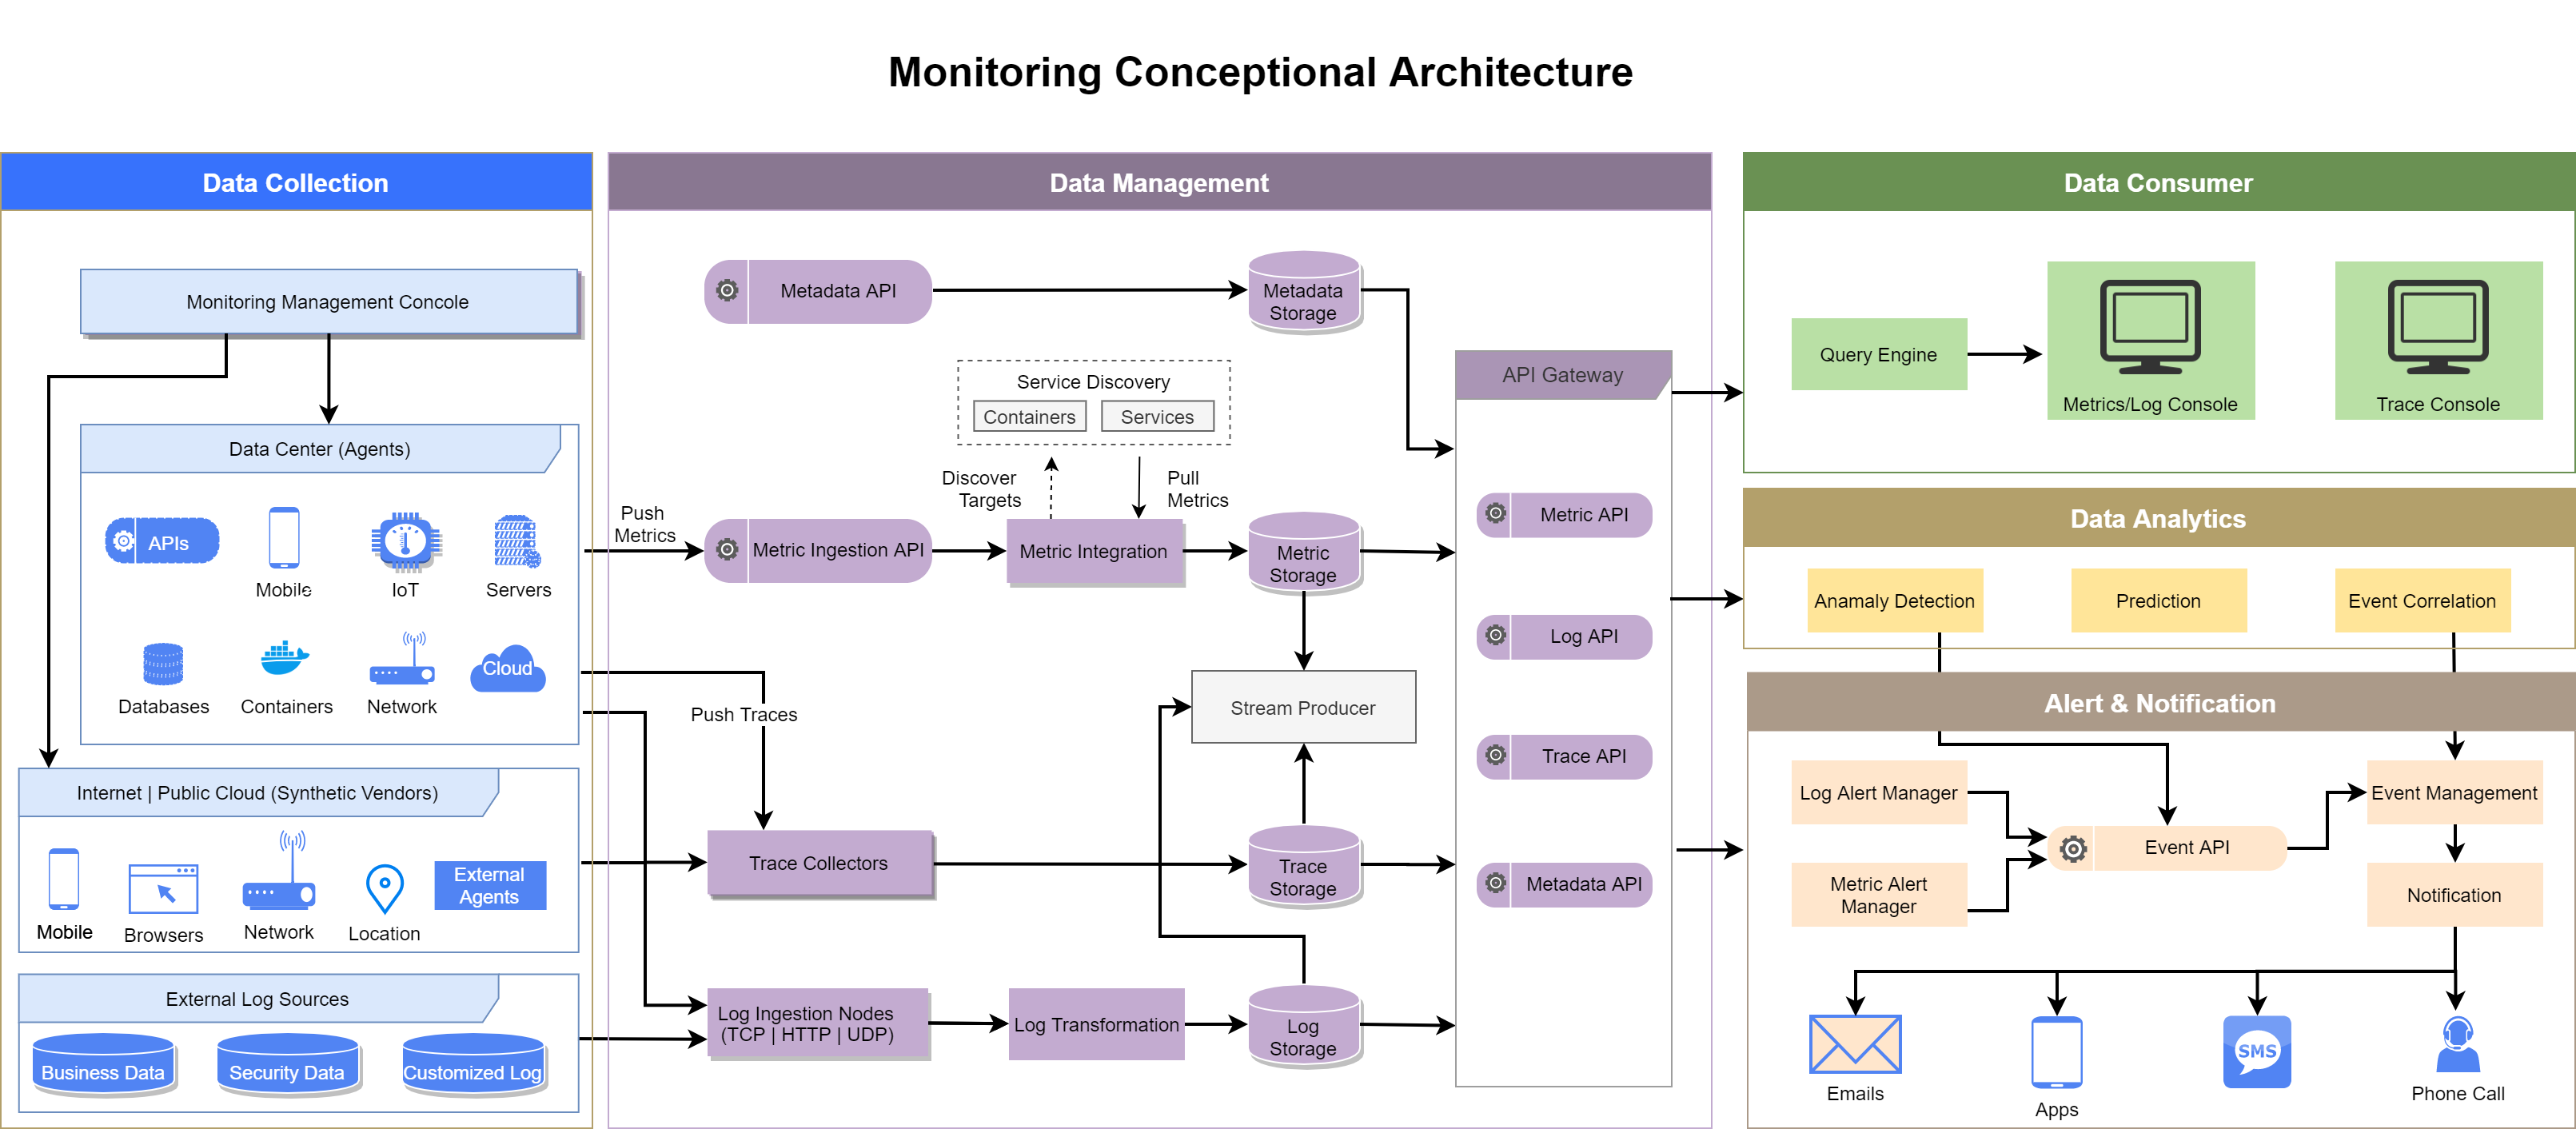
Figure 7. Monitoring Conceptional Architecture
The focus of this conceptional architecture is to provide a holistic view of components and building blocks to implement a monitoring ecosystem, with main considerations as follows:
- Simplify the efforts to identify, pinpoint and escalate issues in IT services.
- Enable advanced operation optimization capability such as anomaly detection, resource planning for proactive risk identification.
- Scalable infrastructure and application for increasing business load.
- Loosely coupled dependencies for preventing vendor lock-in effect.
Before adopting recommended architecture, the corporation might face the situation that different business lines have already set up and incorporated various of storages, tools with regarding to monitoring, consolidation should be firstly considered for the sake of monitoring data integrity, operation efficiency and cost effectiveness. And for the ease of consolidation, storage and event API would be the key start point for integrations since data can be assembled for diverse use cases, as such, multiple data visualization tools can be then employed against an unified and complete monitoring data storage.
Unbundled and Consolidated Architectures
Giving the nature of monitoring data, the primary factor to consider is whether to use separated storage engine for metrics, logs and traces. With the continuously improving technologies in storing and processing heterogenous big data, consolidating monitoring storage platforms even down to one may be practical for some organizations. Another possible configuration is to build the more important domain internally and augment that platform with SaaS products for the other domains. Unifying analytics across local and SaaS domains using a tool such as Grafana or using an analytics platform already deployed within the organization is viable as well.
Each domain has its own storage
- Pros: Every storage is optimized for unique characteristics of that domain.
- Cons: Incurs additional storage and service cost, complexity of managing heterogeneous storage systems.
- Tricks: some analytics platforms can easily integrate or analyze cross-domain data - Grafana supports uniformly analyzing and visualizing or alerting on data from many different sources, however, tracing data has very unique usage pattern in which typically users need a drill down feature to track back to program calling sequence, therefore a customized tracing console is still recommended.

Figure 8. Unbundled Architecture Source: Gartner
Consolidate log and trace storage
- In between the two extremes, the ability of combining logs and traces are commonly supported by a variety of storage engines, Elasticsearch is one of the popular solutions widely adopted for this option.

- In between the two extremes, the ability of combining logs and traces are commonly supported by a variety of storage engines, Elasticsearch is one of the popular solutions widely adopted for this option.
Figure 9. Partially Consolidated Architecture Source: Gartner
All 3 domains in a single repository.
- InfluxDB might be one of few options for this pattern.
From an analytical perspectives, there are also variations of tool selection to conduct analysis, aggregation and reporting, while Grafana advertises supporting both time series data and logging data, many organizations has long history to use Elasticsearch and Kibana on both logs and traces.
- InfluxDB might be one of few options for this pattern.
Data Management
Metrics
Two common models for gathering metrics data are "pushing" data to database and "pull" metrics periodically.
Push Model
A push agent is often implemented on the computer node to collect and aggregate metrics from infrastructure and application. Agent greatly simplify the metrics setting and instrumentation since most metrics are pre-defined, while data is usually able to funnel back to storage with a single click of installation. As such, CPU, memory and disk space are 3 most common metrics that the majority of agents on computer node support to collect by default.
However, 2 typical downsides of push agent are:
- Agent deployment adds significant management overhead. The elegant agent installation, upgrade and patch strategies need to be tailored before applying to resource scaling solution. Not surprisingly, adopting push agent on application using docker is not as simple as deploying agent on applications on host server, as docker is normally expected to dynamically scale up and down, which increases complexity compared to deployment on metal servers or virtual servers with relatively longevous life.
- Agents from different SaaS providers can introduce conflicts or even crash servers due to race hazard. There are reported issues that certain versions of agents from different vendors are incompatible. Moreover, agents are normally black boxes from users' perspective, the root cause of this sort of issues are unclear and it usually takes significant time to pinpoint to the correct suspects. As so it is highly recommended not to use agents from diverse platforms for the same metrics, or to the minimum requirements, run the thorough compatibility testing before installation and upgrade.

Figure 10. Metrics Collection In Push Model Source: Influxdata.com
Pull model
The pull mechanism uses server nodes to scrape metrics over HTTP, the metrics targets often times come from instrumented applications, which means monitoring code conforms to defined protocol has to be embedded to application program. In order to allow ephemeral and short-lived jobs to expose metrics to a polling server node, the pushing can also be supported via an intermediary push gateway. Below is a well-known push solution provided by Prometheus.
In contrast to pushing metrics to data storages, pull model enables metrics customization and flexibility of service discovery, however it introduces code injections since tracing statements are placed to applications. As such, the team who adopts the pull model should have full control over the application code, or think of separating the responsibilities to 2 parts: metrics collections platform management and metric targets developments, owned by operation team and development team respectively.

Figure 11. Metrics Collection In Pull Model Source: prometheus.io
Logs
Due to the complexity introduced by the volume of log data, the variety of log sources and the real-time indexing requirements, it is common to use the ingestion tools from mature and proven log management solution to collect and convert the log data into a normalized format to facilitate further search and visualization.
Logs can be any text with free format, therefore most of ingestion tools are capable of filtering and transforming free text to a semi-structure or structure format, meanwhile support pulling events from a multitude of common sources. Logstash from Elasticsearch suite is one of the open source, cloud-scale log ingestion tools, it has extensive library of input and filter to dynamically transforms and prepares data regardless of format of complexity.
Logstash uses 'pipeline' to control the logical flow of data, a pipeline takes data in through input plugin and passes them to a queue for workers to process.
A typical data flow in a Logstash pipeline, resembles the most data processing flow, includes steps to collect, deserialize, transform and emit data to output sources.

Figure 12. A Typical Logstash Pipeline
In addition to filters which performs intermediary processing like aggregation and value lookup, a codec plugin can play a role to change the data representation as part of input and output, they collectively provide extensive out-of-box features to fulfill the diversified data ingestion and transformation requirements, following is an example to read data from Newline delimited JSON logs and emit output as a MessagePack encoded content.
//Using Codecs to Serialize/Deserialize Data

input {
  //Deserialize newline separated JSON
  file{path => "/some/json.log", codec => json_lines }
}

output {
  //Serialize to the msgpack format
  redis { codec => msgpack}
}
Scaling is the foremost concern before designing a durable logging solution, herein we take Logstash as an example to demonstrate several practices to cope this challenge.
Deploying And Scaling Logstash
Logstash can be used from tailing the log files for single application to enterprise search across data centers, in this session 3 common Logstash architecture patterns are provided based on different user scenarios.
- Directly Ship Data with Beats

Figure 13. Logstash Architecture Pattern 1 - Ship with Beats Source: elastic.co
This is the most straightforward way to quickly collect, parse and index popular log types and view pre-build Kibana dashboard. It's appropriate for simple application service that don't have performance concern while expecting the scaling and resilience capabilities. In this solution, beats can run across thousands of edge host servers, collecting, tailing, and shipping logs to Logstash. Logstash serves as the centralized streaming engine for data unification and enrichment. The Beats input plugin exposes a secure, acknowledgement-based endpoint for Beats to send data to Logstash, they together provide a comprehensive solution that is highly available, flexible, and scalable.
- Horizontal scalability, high availability, and variable load handling
- Message durability with at-least-once delivery guarantees
- End-to-end secure transport with authentication and wire encryption
- Adding Other Popular Sources
Incorporating TCP, UDP, and HTTP protocols enables Logstash to collecting logging data from many other mechanisms that users adopts, Logstash can expose endpoint listeners with the respectivie TCP, UDP, and HTTP input plugins, it can also be achieved by other native plugins run over these three protocols, such as SNMP trap input, syslog input. In addition to tailored application metrics, infrastructure and other IoT devices like Raspberry Pis, smartphones often send telemetry data through one of these protocols.

Figure 14. Logstash Architecture Pattern 2 - Incorporate Multiple Protocols Source: elastic.co
- Integrating with Messaging Queues
If performance under large volume of data is a concern, or an existing message queue needs to be leveraged to connect already existed data sources, the related message queue input plugin can be employed in this circumstance. Logstash provides native input for most popular queuing technologies such as Kafka, Redis or RabbitMQ, an external queuing layer can be acted as data caching or data hub where Beats can persist to and Logstash nodes can consume from.
Integration with steaming or messaging components like Kafka enhanced monitoring solutions in 2 aspects:
- Kafka resembling modules solidify the resilience of logstash especially in the load spike. Logstash can run into very slow in case the event volume is uneven and the peak exceeds the input capacity, Kafka added another asynchronized layer to protect and balance the load between collection and processing.
- Additional messaging layer decouples collection and processing components, enable data to be shipped to other destination, and corporate to readily switch to another data processing and visualization solution.

Figure 15. Logstash Architecture Pattern 3 - Integrate Message Queue Source: elastic.co
Traces
Currently two options are recommended for enterprise tracing implementations: openTracing compatible tracers or APM Vendors.
OpenTracing Compatible Tracers
Below figure illustrates an open tracing architecture from Gartner:

Figure 16. Distributed Tracing Architecture Source: Gartner
The key components (identified with numeric call-outs) are:
- To be instrumented by a tracer, a client library must be available in the programming language being used.
- Most trace vendors provide agents installed on servers or containers to generate traces. In a containerized environment, agent can be either deployed on host level or its own container to accept instrumentations from multiple containers.
- A collector component that is designed to accept trace data from multiple agents or reporters, perform validation and transformation operations as needed, and deliver the trace to the tracer's storage back end.
- A choice of repository technology is supported by Jaeger, Zipkin or OpenCensus, such as Cassandra, MySQL Elasticsearch or an in-memory store for testing. Zipkin additionally includes support for MySQL, although said support includes a caveat about performance at scale. InfluxDB can also be used to store OpenTracing data.
OpenTracing Tracers
Jaeger and Zipkin are among the most commonly used OpenTracing-compatible tracers, while OpenCensus and OpenTelemetry emerged as open source tool that supports instrumentation and traces ingestion for both metrics and traces.
| Vendor | Comments | |
|---|---|---|
| OpenTracing Compatible Tracers | Appdash | An open-source performance and tracing tool. Built by Sourcegraph. |
| OpenTracing Compatible Tracers | Instana APM | A commercial APM suite. |
| OpenTracing Compatible Tracers | Jaeger | An open-source distributed tracing suite originally built by Uber. Now curated by CNCF. |
| OpenTracing Compatible Tracers | LightStep [x]PM | A commercial performance management application built by some of the same engineers responsible for Dapper and the OpenTracing standard. |
| OpenTracing Compatible Tracers | Apache SkyWalking | An open-source APM tool. An Apache incubator project. |
| OpenTracing Compatible Tracers | Zipkin | As mentioned above. It has been adapted to support OpenTracing. |
| OpenTracing Compatible Tracers | OpenCensus | allow you to collect application metrics and distributed traces, then transfer the data to a backend of your choice in real time |
| OpenTracing Compatible Tracers | OpenTelemetry | OpenTelemetry provides a single set of APIs, libraries, agents, and collector services to capture distributed traces and metrics from your application. OpenTelemetry was formed by merging OpenCensus and OpenTracing. Currently OpenTelemetry is currently in pre-release status |
Table 5: Representative Vendors of Tracers
Application Performance Monitoring
Commercially available tools that support OpenTracing are scarce because the technology is emergent. Most trace data being used today is collected using APM tools.
The top 3 APM players, AppDynamics, Dynatrace and New Relic APM showed strong growth in consecutive years, demonstrated the industry trend that big firms are increasingly investing in application performance management throughout the application life cycle. Although APMs typically do not consistently support the OpenTracing interface, it is not a shortcoming as long as the APM tool's tracing capability meets your requirements.
Since the primary goal of APM is to ensure that end-user experience meets competitive quality standards, APM looks monitoring from more user-centric perspective, metrics, logging and tracing are often incorporated collectively to generate detailed analysis for application performance and reliability. However, as most APM solutions are delivered in black-box mode, infrastructures, applications and storages of APM itself can be readily insulated from existing inhouse development monitoring solutions.
Modern platform-based solutions such as New Relics, Dynatrace, and AppDynamics are preferred if the organizations are struggling following problems in proactively monitoring user experience:
- Client-side dynamics: customers are accessing corporate services with a variety of devices, operating systems and browsers. In this case healthy server-side metrics do not necessarily indicate the absence of customer problems. And the complexity of managing a complete set of client devices keeps increasing due to the new versions of devices, operating systems and browsers being released multiple times per year.
- Adoption of SaaS applications: As more organizations progress with a cloud-first strategy, adoption of SaaS-based offerings is growing rapidly (e.g., Microsoft Office 365 and Salesforce). Although SaaS-based software enables faster time to market, it does not offer sufficient means to monitor application and infrastructure health. For instance, Real-user monitoring (RUM) data is captured by injecting JavaScript on web applications, while most SaaS application vendors disallow injecting a monitoring vendor’s JavaScript into their code, therefore limiting the ability of RUM.
- Numerous KPIs: With numerous metrics captured across the technology stacks, organizations end up with a “death by a thousand metrics” situation. They struggle to understand the context around large numbers of metrics to find the right KPIs that correlate to customer engagement and business impact.
- Monitoring gaps: Traditional infrastructure monitoring, logs and traces do not provide visibility into some key elements of the end-user experience, such as content delivery network (CDN), DNS and internet routing issues.
To tackle the challenges fore-mentioned, Gartner also suggested organizations to incorporate synthetic monitoring, which is a technique widely used to simulate user's actions in a regulated environment, provide traceable information and actionable insights on the problem.
Synthetic and traditional monitoring differ in scope and objectives, a typical synthetic monitoring case uses an invoked browser on agents to simulate core customer actions on a webpage, as such the issues on specific browser, device, CDN or 3rd party SaaS vendor can be identified compared to traditional monitoring solution which mainly focused on server-side within data center. Figure 17 illustrates the scope comparison between synthetic and other monitoring mechanism.

Figure 17. Synthetic Monitoring Scope Source: Gartner
Synthetic Monitoring Solution
In commercial area the synthetic monitoring are primarily supported by APM centric solutions, table 3 listed major players who provide synthetic monitoring by its primary function. Comprehensive open-source solution is rare in this domain, WebPagetest and sitespeed.io are 2 popular options if performance monitoring is the main focus, however, both solutions requires advanced skills and mature capabilities in automation, data storage and analytics.
| Vendor | Product, Service or Solution Name |
|---|---|
| Apica | Apica Synthetic |
| Catchpoint | Synthetic Monitoring, Real User Monitoring, Internet Intelligence, DEX Sonar, Managed Monitoring |
| ENow | End-user experience monitoring, Office 365 monitoring and reporting |
| GSX | GSX Gizmo for Office 365 monitoring |
| Datadog | Datadog Synthetics |
| eG Innovations | Synthetic monitoring, real-user monitoring |
| ITRS Group | ITRS Synthetic Monitoring |
| Rigor | User Experience |
| AppNeta | AppNeta |
| ThousandEyes | ThousandEyes |
| AppDynamics | End User Monitoring, Browser RUM, Mobile RUM, Browser Synthetic Monitoring, IoT monitoring |
| Broadcom | DX App Experience Analytics, DX App Synthetic Monitor |
| Dynatrace | Synthetic monitoring, RUM, Session Replay, RUM for SaaS vendors, mobile app monitoring |
| IBM | IBM Cloud Application Performance Management |
| ManageEngine | Site24x7: Real User Monitoring, website monitoring |
| Micro Focus | Micro Focus AppPulse Active, Micro Focus AppPulse Mobile, Micro Focus AppPulse Web |
| Microsoft | Azure Monitor |
| New Relic | New Relic Browser, New Relic Mobile, New Relic Synthetics |
| OneAPM | OneAPM Browser Insight, OneAPM Mobile Insight |
| Oracle | Oracle Management Cloud end-user experience monitoring |
| Riverbed | SteelCentral Aternity,SteelCentral AppResponse, SteelCentral AppInternals |
| SolarWinds | SolarWinds Pingdom, SolarWinds Web Performance Monitor |
| Tingyun | Tingyun App, Tingyun Browser, Tingyun Sense |
Table 6: Representative Vendors of Digital Experience Monitoring by Primary Function Source: Gartner (December 2019)
Storage
There are a variety of existing storages for metrics, logs and traces in the industry, following list consists of representative vendors with other rising stars in recent years.
| Category | Vendor | Comments |
|---|---|---|
| Time-series Storage | Atlas | Open source from Netflix. Leverages in-memory store for current data. History in S3. |
| Time-series Storage | DalmatinerDB | Open source and built upon ZFS(Z File System) and Riak core. Written in Erlang. |
| Time-series Storage | Graphite (Whisper) | Open source from Orbitz. Written in Python. Labels/dimensions not supported. |
| Time-series Storage | InfluxDB | Open source, modern platform (Tick Stack) with commercial edition. Written in Go. |
| Time-series Storage | OpenTSDB | Open source from StumbleUpon. Leverages Apache HBase for storage. Written in Java. |
| Time-series Storage | Prometheus | Open source from SoundCloud. Written in Go. Currently a CNCF(Cloud Native Computing Foundation) project. |
| SaaS-Based Metrics Storage | Datadog | Offers custom agent and is expanding into other types of monitoring. |
| SaaS-Based Metrics Storage | LogicMonitor | Collector software can pull from multiple nodes and forward to the platform. |
| SaaS-Based Metrics Storage | Outlyer | Offers custom agent. Also supports collecting via collectd and InfluxDB. |
| SaaS-Based Metrics Storage | SignalFx | Agent is modified collectd. Has implemented analytics language called SignalFlow. |
| SaaS-Based Metrics Storage | Wavefront (now part of VMware) | A variety of ways to get data into Wavefront including collectd, APM integration, cloud provider integration and Telegraf. Also supports the collector model. |
| Log Storage | Elasticsearch | |
| Log Storage | Splunk | |
| SaaS-Based Log Storage | Datadog | Recent entry into log management from a primarily metrics history. |
| SaaS-Based Log Storage | Elastic Cloud | The Elastic stack hosted by Elastic. Available on both AWS and Google Cloud Platform (GCP). |
| SaaS-Based Log Storage | Honeycomb | Discussed in more detail in text below. |
| SaaS-Based Log Storage | Kentik | Discussed in more detail in text below. |
| SaaS-Based Log Storage | Loggly | Supports a syslog agent. Recently acquired by SolarWinds. |
| SaaS-Based Log Storage | LogRhythm | Predominantly a SIEM solution. |
| SaaS-Based Log Storage | Sematext | Has offerings in APM, hosted Elasticsearch and metrics. |
| SaaS-Based Log Storage | Splunk Cloud | Fully functional Splunk Enterprise delivered in a SaaS model. |
| SaaS-Based Log Storage | Sumo Logic | Advanced analytics. Can be deployed with an on-site or hosted collector |
Table 7: Representative Vendors of Monitoring Data Storage
Data Consumption
Data visualization is one area that has advanced well beyond previous-generation, almost every SaaS-based monitoring solution provided build-in capabilities pertaining to exploration, visualization or data analytics. As so the primary factor to evaluate the visualization solution is how easily to integrate data from multiple sources across technology stacks.
Organizations integrating multiple data sources for both metrics and logs into their analytics platform should consider Grafana for their custom analytics. Grafana is a capable, widely used, open-source analytics, visualization and notification platform that has a focus on IT use cases and is increasingly common in this space. It supports a variety of data sources and notification channels and has an active community, and commercial support is available. Prometheus recommends Grafana as its analytics and notification tool of choice.
If InfluxDB is used for storing metrics, Chronograf should be considered as the visualization and analytics tool, the "TICK" stack — Telegraf, InfluxDB, Chronograf and Kapacitor is an integrated platform for metrics recommended by InfluxData.
For log-centric data visualization, Splunk and Elastic Kibana are dominant vendors in this space. Splunk provides diverse data analysis capabilities across data generated on IT infrastructure, application, security, IoT and business, while Kibana is the comparable solution in both open-source and commercial editions. Both Splunk and Kibana can readily be onboarding exploration, visualization, dashboard and report in a scaled manner, and more customized visualization is supported by integrating self-developed plug-in with analysis engine.
Tracing data is most application-specific and can be challenging to visualize by a common tool, APM tools like AppDynamic, Dynatrace support drill down features if you want to dig into more details to pinpoint outstanding applications issues, as such it's understandable to favor mature native console provided by selected tracers.
Alerting and Notification
Each of the monitoring domains has alerting capability along with the respective solution, it's common to define every monitoring tool as a notification source and incorporate a centralized event management platform to connect digital signal to support personnel.
The complexity of managing alert sources, notification vehicle preferences, on-call rotations and prompt update of cascaded contact information, has given rise to specialized services offered by PagerDuty, VictorOps and OpsGenie.
All of paging tools fore-mentioned provided core functions such as event handling(acknowledge, resolve, etc), contacts and rotation management, paging policy definition, push notification/SMS/Call, in addition, since many corporations have adopted micro-service oriented architecture with diverse data sources, it's inevitable all commercial paging tools support integrating data via comprehensive event API. As such, in order to avoid vendor lock-in effect, a customized proxy or anti-corruption layer is recommended to bridge between event sources and alerting platform, and the flexibility of combining multiple platforms and heterogeneous systems comes in handy to develop advanced features like automated problem resolution.

Figure 18. How PagerDuty Managers the Complexity in Alerting Source: AWS DevOps Pagerduty Webinar
Data Analytics
Applying advanced analytics to the telemetry streaming out of our applications and delivery platforms enables capabilities such as:
- Adaptive thresholds for anomaly detection: Determining what "normal" is and notifying based on deviations from that.
- Event correlation: Constructing complex machine learning models of system behavior, correlating events and data using the model, with reinforcement such that it "learns" over time to effectively avoid alert fatigue and nuisance.
- Predictive analysis: The ability to identify impending events and proactively respond, for instance, provisioning additional resources before exhaustion can prevent downtime.
Anomaly Detection
Anomaly detection is the process of identifying unexpected or abnormal events in monitoring datasets, most businesses are using anomaly detection as an assistance to address potential issues that are not obvious from the human perspective, such as identifying misconducts of drivers from millions of taxi fares data.
Nevertheless what makes the anomaly detection the only viable option for future tool is that simple threshold-based monitoring doesn't scale, to the contrary anomaly detection technique enables to perform dynamic threshold adjustment on real-time data for 100 metrics, or 1000 servers at once. In the past it has been very common to set up an alert on server CPU utilization at a given, fixed percentage — say 90% to 95%, perhaps adding a time component to filter out momentary blips in utilization, inevitably this approach can introduce either false alert or failure in triggering alert as there is never a perfect static usage percentage. An anomaly detection-based alerting changes utilization baseline over time. This way, if a server regularly runs at 50% utilization during weekdays, a spike to 80% at 3:00 a.m. on Tuesday can correctly be identified as anomalous, and an alert can be generated. On the other hand, a two-hour spike to 90% on the last day of the month is a normal part of month-end processing and does not need to trigger an alert. This is a simple example, but it demonstrates how powerful anomaly detection can be, particularly when data from multiple signals is analyzed together.
However, Preetam Jinka and Baron Schwartz warn in their book Anomaly Detection for Monitoring that “It (anomaly detection) cannot prove that there is an anomaly in the system, only that there is something unusual about metric you are observing.” As so it's important to treat anomaly detection as an additional way to simplify the monitoring creation and warn you about new behaviors and data patterns in time, meanwhile argument with other approaches such as crucial path monitoring or APM to ensure 100% anomalous cases can be captured before users' awareness.
Is Anomaly Detection the Right Approach?
There is no doubt that not all monitoring problems are solvable with anomaly detection, a rule of thumb is that anomaly detection are beneficial for problems can be clearly defined and measured within a fixed time interval. Disk fullness is one of classic examples in which anomaly detection is not helpful. Disks with 95% usage may be acceptable if it hosts a huge database of that 5% means sufficient space of another hundreds of gigabytes, or there is an automated clean up process when disk reaches to 90% so it always drop back by themselves, in these scenarios we care more about the time it lefts before running out of the space, as so it is more about prediction rather than anomalies detection.
Anomaly detection can be the best-fit if the problem has following characteristics:
- There is a clear and unambiguous definition of the problem you' trying to detect.
Measurable metrics are associated with the target problem. Herein the metrics are typically the time-series data along with rollup interval and labels, the business owners or developers can use them as an indicator to directly link to desired outcome, actual impact, etc. Example metrics you could include:
- Error rate
- Throughput
- Latency (response time), although this is tricky because latency almost always has a complex multi-modal distribution
- Concurrency, service demand, backlog, queue length, utilization, and similar metrics of load or saturation of capacity
- For a more complicated problem, you might need a known model to summarize the problem, such as poisson model or queueing theory, as so anomaly can be clearly defined by corresponding model.
Anomaly Detection Methods
Most anomaly detection methods in real practice are classified as unsupervised machine learning, however, the professions also noticed that the right combination of supervised and unsupervised machine learning works appropriately in many cases . You want the vast majority of data classifications to be done in an unsupervised manner (without human interaction). However, you should still have the option to have analysts feed algorithms with datasets that will be valuable to creating baselines of business-as-usual behavior. A hybrid approach ensures that you can scale anomaly detection with the flexibility to make manual rules regarding specific anomalies.
We will leverage a practical decision tree from book 《Anomaly Detection Monitoring》 to summarize the practical way to pick the appropriate model for your problem. This flowchart is too extreme simplification to cover all scenarios, but still a good start to get close to this space.

Figure 19. A Worked Example of Decision Tree Source: 《Anomaly Detection Monitoring》2016
Build vs. Buy
Various types of anomaly detection in other professions have been a standard practice, this applies to domains such as credit card fraud detection, monitoring for terrorist activity, finance, weather, gambling, and many more too numerous to mention. In contrast, in systems monitoring we generally do not regard anomaly detection as a standard practice, but rather as something potentially promising but leading edge.
General-purpose solutions are either impossible or extremely difficult to achieve in many domains. This is partially because of the incredible diversity of machine data. There are also apparently an almost infinite number of edge cases and potholes that can trip you up. In many of these cases, things appear to work well but eventually they really don’t, or they accidentally work well, leading you to think that it is by design. In other words, whether something is actually working or not is a very subtle thing to determine.
Almost all modern monitoring solutions provides anomaly detection or the like features to some degree, the implementation varies in all aspects but gets constantly renovated in a head-to-head competition environment, however, apparently there is no one solution to rule them all, also the users shouldn't expect that the out of box functions can automatically apply to the all problems, because it cannot work generically across all systems, all metrics, all time ranges, and all frequency scales,
Whether to buy or to build mainly depends on the complexity of your problems and size of the business, if the only concern is smart threshold learning to a changing system condition, the build-in functions from commercial tools are first choice. Reversely, for big firm with a multitude of complicated and domain specific problems to analyze and detect, self-developed solution or a build-and-buy hybrid model are the first thing to consider.
Other facts to consider for building and buying anomaly detection:
- The size of your company and the volume of data that must be processed.
- Your budget for implementing this new system.
- The development and machine learning capability of your organizations to deliver self-developed solution.
- Maintenance Capacity within your IT team.
- Expected time to value in terms of immediate need for anomaly detection and the demands of business stakeholders.
- Expansion plans for your business and how that will impact data analytics.
Predictive Analysis
Prediction is often used for planning of application capacity or infrastructure resources in monitoring domain, for e-commerce business, it's crucial to understand the predicted page views in Cyber Monday to get capacity ready to scaled up to that level. Typically predictive analysis of monitoring is based on time series data, however not all time series data can be effectively predicted and used afterwards, in our experience, prediction works better for those cases with a natural trend or underlying pattern, and associated time window is in a reasonable interval to enable corresponding actions being taken. Disk space usage is an good example suited for predictive analysis, subsequent remediation can be implemented after certain disks are alerted to be full in next few days. CPU, memory usages, on the other hand, can be impractical to predict given their uneven and fluctuated nature, many applications can have CPU bumped up to 90% instantly then dropped back shortly, other factor to make it useless is the lack of the common course of actions, 90% memory usage can be normal in many cases while being an anomaly in other scenarios.
Time Series Forecasting
A time series can be decomposed to 3 parts: trend, seasonal or periodical variation and irregular component, typical methodology to forecasting a time series extrapolate the trend and cyclical patterns, and use the irregular variation to evaluate the accuracy of predictions.

There are two most often used forecasting models, moving average(MA) models and autoregressive(AR) models, these 2 classes depend linearly on previous data points, popular variants derived from these 2 approaches are listed as following:
- Simple Moving Average
- Exponentially weighted moving average(EWMA)
- Holt’s Linear Trend method
- Holt-Winters Method
- Autoregression
- Autoregressive Integrated Moving average(ARIMA)
- Long short-term memory (LSTM)
Simple Moving Average
Moving average uses the mean of fixed number of previous values to predict future values, this is based on assumptions that only the recent values matter. Simple moving average can be quite efficient if you choose the right number of periods for calculation, however, the downside is you can only use it for predicting the short run averages of new values, and it's hardly to see the up and down fluctuation among the predicted values which is common in any time series data.
An quick improvement can be applied on moving average is called Weighted moving average method, in the real world we often weight more on the most recent time points, instead of picking a window size, a sequence of weights which should add up to 1 are required to calculate the prediction.

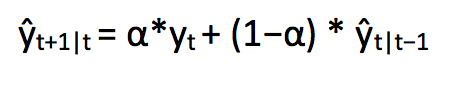
Exponentially weighted moving average(EWMA)
Similar to weighted moving average, EWMA uses exponential variables to depreciate older values quicker, a simple exponential smoothing algorithm can be written as:
Holt’s Linear Trend method
Holt extended simple exponential smoothing to allow forecasting of data with a trend. It is nothing more than exponential smoothing applied to both level(the average value in the series) and trend. To express this in mathematical notation we now need three equations: one for level, one for the trend and one to combine the level and trend to get the expected forecast ŷ.
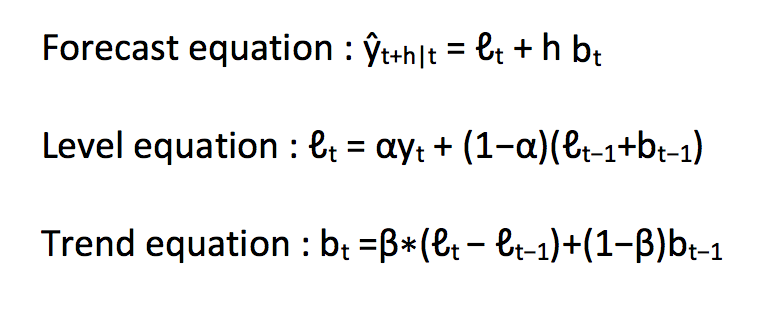
In the above three equations, you can notice that we have added level and trend to generate the forecast equation.

Figure 20. An example of results from Holt's Linear Trend Method Source: analyticsvidhya.com
Holt-Winters Method
A step further from linear trend method takes seasonality into account, one algorithm that we can use in such a scenario is Holt’s Winter method. The idea behind triple exponential smoothing(Holt’s Winter) is to apply exponential smoothing to the seasonal components in addition to level and trend.
The Holt-Winters seasonal method comprises the forecast equation and three smoothing equations — one for the level ℓt, one for trend bt and one for the seasonal component denoted by st, with smoothing parameters α, β and γ.
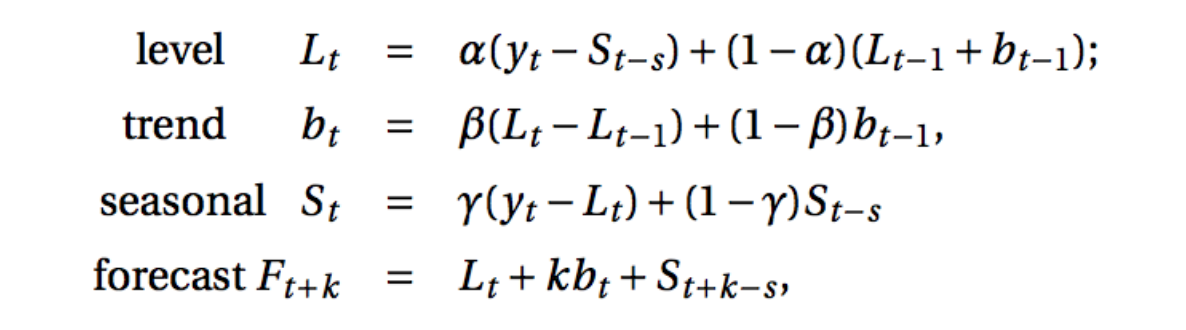
where s is the length of the seasonal cycle, for 0 ≤ α ≤ 1, 0 ≤ β ≤ 1 and 0 ≤ γ ≤ 1.

Figure 21. An Application of Holt-Winters Method Source: analyticsvidhya
Augoregression
Using a simple regression models for time series often encountered correlated residuals, these autocorrelated errors in regression most often are caused by incomplete set of explanatory variables, autoregressive models(AR) provides an alternative in case we can not observe or use a leading indicator to anticipate the coming changes, as such, autoregression is a regression that uses prior value of the response variable as predictors.
The most basic autoregression is a simple regression that has one lag, Yt−1, as a predictor,
Yt=β0+β1Yt−1+ϵt
Since the slopes in autoregression are impractical to interpret, autoregression are made for short-term forecasting and little else.
Autoregressive Integrated Moving average
While exponential smoothing models were based on a description of trend and seasonality in the data, ARIMA models aim to describe the correlations in the data with each other. An improvement over ARIMA is Seasonal ARIMA. It takes into account the seasonality just like Holt’ Winter method. You can study more about ARIMA and Seasonal ARIMA models and it’s pre-processing from these articles (1) and (2).
Long Short-Term Memory (LSTM)
LSTM is an artificial recurrent neural network (RNN) architecture[1] used in the field of deep learning. LSTM networks are well-suited to classifying, processing and making predictions based on time series data, since there can be lags of unknown duration between important events in a time series. LSTM is a great option if you have multiple time variant input features(explanatory variables) available for prediction.
A common LSTM unit is composed of a cell, an input gate, an output gate and a forget gate. The cell remembers values over arbitrary time intervals and the three gates regulate the flow of information into and out of the cell.
Machine Learning in Monitoring
Event Correlation
Event correlation takes data from application or infrastructure logs and then analyze to find the relationship among them. Tools that use correlated events can then determine follow-up actions such as alerting responsible teams or applying automated remediation based on prescript rules.
In essence, event correlation is a technique that relates various events to identifiable patterns, some important use case include:
- Security precautions
- Fraud detection
- Root cause analysis
- Reducing alert fatigue
In a dynamic and complex IT environment, one of the biggest challenges is how to manage the large number of events that originated from various sources. Without customized event correlations, operation staff can be easily overwhelmed by noise of events, a network administrator can deal with, say, 25 events based on cross-referencing intrusion alerts against firewall entries and host/asset databases much more efficiently than when he must scan 10,000 mostly normal log entries.
Another example is incident management, where hundreds of alarms are sounded conveying that multiple servers and interrelated services are no longer reachable. Event correlation tools can analyze the data to determine the root cause, allowing the responsible department to focus on implementing a solution rather than spending valuable time trying to pinpoint the cause, and potentially prevent breach in service level agreement(SLAs) due to missing of issues really matters to business services.
As a result, after appropriate correlation is implemented, some of benefits of using event correlation techniques include:
- Real time threat visibility. Active event correlation and analysis can help IT departments detect threats in real time. Failures, security breaches, and operational issues all affect business. Instead, these can be successfully avoided.
- Continuous compliance reports. Federal, state and local regulations may require varying levels of compliance with security and networked systems. Event correlation techniques can be used to ensure a constant monitoring of all IT infrastructures. Reports can then be generated to detail security-related threats and events, along with the steps needed to prevent potential risks.
- Reduces operational costs. Event correlation tools automate processes such as the analysis of large work flows to reduce the number of relevant alerts. As a result, the IT department can spend less time trying to make sense of it all and more time resolving immediate threats.
- Improves time management. Fewer resources are needed as contemporary event correlation tools are user-friendly and efficient. Plus, they can save a lot of time relative to using SIEM tools for event correlation and analysis.
Approaches to Event Correlation
Here we only focus on the automated way to correlate events as manual correlation of large amount of events is time-consuming, labor-intensive, and is not scalable as the business grows.
- Rule-Based Correlation. A common and traditional approach to event correlation is rule-based approach. These forms of correlation involve the definition of how events themselves should be analyzed, and a rule-base is built for each combination of events. The early days of network management made use of many of these solutions. As IT infrastructures have evolved, the amount of data collected and the effort required for building rules to account for every possible event combination makes this approach very cumbersome.
- History-Based Correlation. Another approach is to learn from past events. Terms like “machine learning” and “analytics” have been used for this approach. What’s common is learning behavior from past events, and if these patterns re-occur you can quickly isolate where the issue was the last time it was observed. These approaches are independent of the technology domain, so no domain knowledge is needed. This may limit the level of detail that can be obtained, and if the patterns have not been learned from experience, then no correlation will take place. The drawback, of course, is that when problems occur in in the software layers, many of the event patterns are new. Furthermore, the dynamicity of today’s environments makes it less likely that these problem patterns will reoccur.
- Domain-Based Correlation. These approaches use terms like “embedded correlation.” This approach does not use rules per se, but organizes the measurement data using layered and topology-based dependencies in a time-based model. This enables the monitored data to be analyzed based on dependencies and timing of the events, so the accuracy of the correlation improves as new data is obtained.
The advantage of this approach is that users can get very specific, granular, actionable information from the correlated data without having to maintain rule bases or rely on history. And since virtual and cloud infrastructures are dynamic, the dependencies (e.g. between VMs and physical machines) are dynamic. So the auto-correlating tool must be able detect these dynamic dependencies to use them for actionable root-cause diagnosis.
A variety of techniques and operations can be used in developing event correlation:
- Compression takes multiple occurrences of the same event, examines them for duplicate information, removes redundancies and reports them as a single event. So 1,000 "route failed" alerts become a single alert that says "route failed 1,000 times."
- Counting reports a specified number of similar events as one. This differs from compression in that it doesn't just tally the same event and that there's a threshold to trigger a report.
- Suppression associates priorities with alarms and lets the system suppress an alarm for a lower-priority event if a higher-priority event has occurred.
- Generalization associates alarms with some higher-level events, which are what's reported. This can be useful for correlating events involving multiple ports on the same switch or router in the event that it fails. You don't need to see each specific failure if you can determine that the entire unit has problems.
Time-based correlation can be helpful establishing causality -- for instance, tracing a connectivity problem to a failed piece of hardware. Often more information can be gleaned by correlating events that have specific time-based relationships. Some problems can be determined only through such temporal correlation. Examples of time-based relationships include the following:
- Event A is followed by Event B.
- This is the first Event A since the recent Event B.
- Event A follows Event B within two minutes.
- Event A wasn't observed within Interval I.
Root Cause Analysis
Herein the ultimate goal is to use the advanced algorithm or machine learning techniques to automatically pinpoint the root cause among a number of anomalies, or in some scenarios people want to quickly find out the events that are closest to the real cause to shorten the lead time to resolve a incident.
G-RCA(Generic Root Cause Analysis Platform) is one of the RCA frameworks that has successfully implemented for service quality management in AT&T, it largely helped tackle the common challenges we've often seen in the context of RCA such as complex service dependency model, ever-changing environment. G-RCA contains a comprehensive service dependency model that incorporates topological and cross-layer relationships, protocol interactions, and control plane dependencies. G-RCA abstracts the root cause analysis process into signature identification for symptom and diagnostic events, temporal and spatial event correlation, and reasoning and inference logic. G-RCA provides a flexible rule specification language that allows operators to quickly customize G-RCA and provide different root cause analysis tools as new problems need to be investigated.
A typical G-RCA design is illustrated as following diagram:

Figure 22. G-RCA Architecture Source: Colorado State University and AT&T Labs-Research
Fine-grained details can be found in the research paper of G-RCA, here is the extraction of terms definition.
- Data Collector: Proactively collects information from various network devices and systems, normalizes them to facilitate analysis across data sources.
- Spatial Model: Consists of topological information, cross-layer dependency, logical and physical device association, etc, normally the mapping is time-dependent.
- Service Dependency Model: Built on top of event definitions and spatial model, consists of diagnosis rules. G-RCA has pre-defined common used diagnosis rules, application specific rules can be added afterwards.
- Temporal Correlation Module: Given a symptom event instance, find out the temporally correlated diagnostic event instances.
- Spatial Correlation Module: Given a symptom event instance, find out the spatially correlated the diagnostic event instances
- Root Cause Reasoning Module: Determine the root cause of a symptom event instance based on temporally and spatially correlated diagnostic event instances. It is recommended to use rule-based decision-tree-like reasoning, a priority value is assigned to each edge in the diagnosis graph, the higher the priority value, the more likely the diagnostic event to be the real root cause
Although the traditional G-RCA fulfilled the most common challenges, it's a rule based engine that requires operators to continuously feed the ongoing diagnostic events, which is impractical in the scale the size of contemporary IT giants', herein an evolved architecture with rules learning techniques enabled emerged:

Figure 22. Evolved G-RCA Architecture with Machine Learning
In this improved design, instead of prescript rules, machine learning methodologies are leveraged to mine rules and facilitate the rule generation, the Service Operators now focus purely on complex and suspect root cause refinement with assistance from an intelligent label tool.
There are a wide range of RCA models available based on different analysis strategy, please refer to following paper to get basic understanding of a catalog of RCA model and general guidance to choose the best suitable root-cause analysis technique.
Survey on Models and Techniques for Root-Cause Analysis
Monitoring in Hyperscale Cloud Providers
AWS, Microsoft Azure, and Google Cloud Platform have all included monitoring within their platforms, although their capabilities differ. Gartner has explored AWS and Azure monitoring in "Assessing Availability Monitoring and Performance Monitoring in Amazon Web Services" and "Assessing Microsoft's Availability- and Performance-Monitoring Tools for Azure-Based IT Services." Google's Stackdriver monitoring platform has capabilities that closely map to the monitoring domains discussed here, and it also includes support for monitoring AWS resources.
Each of these cloud providers includes mechanisms(API, etc) that allow customers to collect and ingest performance and availability data about resources provisioned within their platforms. This data can be ingested:
- By monitoring services native to the platform
- By monitoring services native to another cloud platform
- Using a third-party SaaS monitoring service
- Using a composite, enterprise-monitoring platform such as Prometheus
- Using a combination of the above
Monitoring at scale is a data management and analysis problem at its core, and each cloud provider, by definition, offers services that support data management and analysis at scale, however, comparing to the well-developed commercial solutions, cloud native monitoring solution as a new comer has many limitations in terms of function diversity and user friendliness. As such, organizations can leverage these services to construct custom-made monitoring platforms, potentially including self-developed services or a cloud provider's AI and ML capabilities as well.
Organizations that seek to monitor resources and applications in a single cloud provider should evaluate the platform-native services available from that provider to identify how much of the monitoring platform can be assembled natively.
Recommended Reading
Covering monitoring architecture in one article has been very challenging, I hope this article provides a head start on your monitoring journey, I strongly encourage readers to refer to the references and citations to get exhaustive details on concerned topics.
- 《Dapper, a Large-Scale Distributed Systems Tracing Infrastructure》, Google.
- "Site Reliability Engineering" , Google.
- Github.com/opentracing/
- "Anomaly Detection for Monitoring", Baron Schwartz, Preetam Jinka
Reference
- http://www.uml.org.cn/itil/201901253.asp
- https://en.wikipedia.org/wiki/Event_correlation
- https://www.elastic.co/guide/en/logstash/7.x/deploying-and-scaling.html
- https://github.com/open-telemetry
- "Use Synthetic Monitoring to Enhance User Experience for Hosted and SaaS Applications", Gartner, 2019
- "Monitoring Modern Services and Infrastructure", Gartner, 2018
- "Anomaly Detection for Monitoring", Baron Schwartz, Preetam Jinka, 2016
- https://www.anodot.com/blog/what-is-anomaly-detection/
- https://www.analyticsvidhya.com/blog/2018/02/time-series-forecasting-methods/
- https://digitalguardian.com/blog/what-event-correlation-examples-benefits-and-more